Processing Notes: Meg Tivey's Mavs40
SRV, 7/11/02
- Received the raw data file from Meg
- Converted her metadata Word file (MAVSdataformat.doc) to html (MAVSdataformat.html)
- Made following changes and saved as mav40proc.dat:
- Removed ^M symbols, blank first line and incomplete last line, leaving 66897 lines total
- Noted: Of 66897 initial lines, line 3314 had first spd/brg/sign/w data (non-*), line 3411 is first stable bottom record
- Removed the surface data, judging bottom emplacement based on temperature record stability and absence of w>5cm/s... deleted lines 1-3410
- Noted erroneous row at line 5476 (looks like subsequent 2 min row got chopped) and made the following changes:
- original data:
18 02:28:03   1.90    0.00  1.3  0.4   4.2  68    1.2
18 02:30:03   1.88    0.00  1.0  0.3   5.9  41    2.01.2  0.3   5.7  74 -  0.1
18 02:34:03   1.90    0.00  1.1  0.5   4.8  27    0.5
- after edits, including interpolation of T:
18 02:28:03   1.90    0.00  1.3  0.4   4.2  68    1.2
18 02:30:03   1.88    0.00  1.0  0.3   5.9  41    2.0
18 02:32:03   1.89    0.00  1.2  0.3   5.7  74 -  0.1
18 02:34:03   1.90    0.00  1.1  0.5   4.8  27    0.5
- Noted month change (June-July) at line 14761 (including newline added above)
- Noted another erroneous line at 19493 (including newline added above)
- original data:
7 13:42:03   2.27    0.00  3.0  0.4   4.1 143    2.0
7 13:44:03   2.27    0.00  2.8  0.9   5.4 102    1.0  2.4 178    2.3
7 13:48:03   2.30    0.00  2.6  0.7   1.4  34    0.0
- after edits and interpolation:
7 13:42:03   2.27    0.00  3.0  0.4   4.1 143    2.0
7 13:44:03   2.27    0.00  2.8  0.9   5.4 102    1.0
7 13:46:03   2.28    0.00  2.7  0.8   2.4 178    2.3
7 13:48:03   2.30    0.00  2.6  0.7   1.4  34    0.0
- Another month break (July-Aug) at newline 37080
- Another month break (Aug-Sep) at newline 59400
- Erroneous newline 61201
- original:
3 12:00:03   1.94    0.00  3.0  1.0   5.2  25    1.4
3 12:02:03   1.93    0.00  2.9  1.0   8.9 358    1.5 2.5  1.0   8.2   4    1.1
3 12:06:03   1.93    0.00  2.4  1.0   7.9   0 -  0.1
- after edits and interpolation:
3 12:00:03   1.94    0.00  3.0  1.0   5.2  25    1.4
3 12:02:03   1.93    0.00  2.9  1.0   8.9 358    1.5
3 12:04:03   1.93    0.00  2.5  1.0   8.2   4    1.1
3 12:06:03   1.93    0.00  2.4  1.0   7.9   0 -  0.1
- Last stable bottom record is newline 66527 (stable T and w<5cm/s)
- Last non-* line is 66583 (implies ascent took 46*2=92 minutes)
- Removed trailing (non-bottom) data lines 66528-66900 (last line)
- Noted weird jump in pitch/roll values near newline 1172
- Combined sign and w columns to be a column of signed vertical velocity
- Replaced " 0.00 " with " 0.00 ", thereby making only the last column gap have a width of 4 spaces (not necessary, it turns out...)
- Replaced all " - " with " -"
- Replaced all " - " with " -"
- Final mav40proc.dat has 63172 lines (imples 3727*2/60=124hr discarded)
- Replaced all ":" with " "
- Found more *** on finalnewline 26618
- original:
22 04 54 03 1.87 0.00 2.0 1.2 *** *** ***
- interpolated:
22 04 54 03 1.87 0.00 2.0 1.2 2.3 33 1.5
- Found more *** on finalnewlines 33086-87
- original:
   31 04  30  03   2.10   0.00  2.6  1.0  ****  ***  ****
   31 04  32  03   2.06   0.00  2.4  1.0  ****  ***  ****
- interpolated:
   31 04  30  03   2.10   0.00  2.6  1.0   5.5   3    1.8
   31 04  32  03   2.06   0.00  2.4  1.0   6.0   5    1.1
- Found more *** on finalnewlines 34674
- original:
2 09 26 03 1.93 0.00 2.9 1.0 **** *** ****
- interpolated:
2 09 26 03 1.93 0.00 2.9 1.0 5.4 348 3.4
- Found more *** on finalnewlines 42588
- original:
13 09 14 03 1.95 0.00 2.5 1.0 **** *** ****
- interpolated:
13 09 14 03 1.95 0.00 2.5 1.0 6.5 15 1.8
- Final 11 fields are:
1    2   3    4    5  6  7      8     9          10       11
day, hr, min, sec, T, P, Pitch, Roll, spd(cm/s), bearing, signed vertical spd
- Imported mav40proc.dat into Matlab and converted day/time to mjd using proc_meg2.m
- Saved final data as mav40proc.mat
Initial analysis
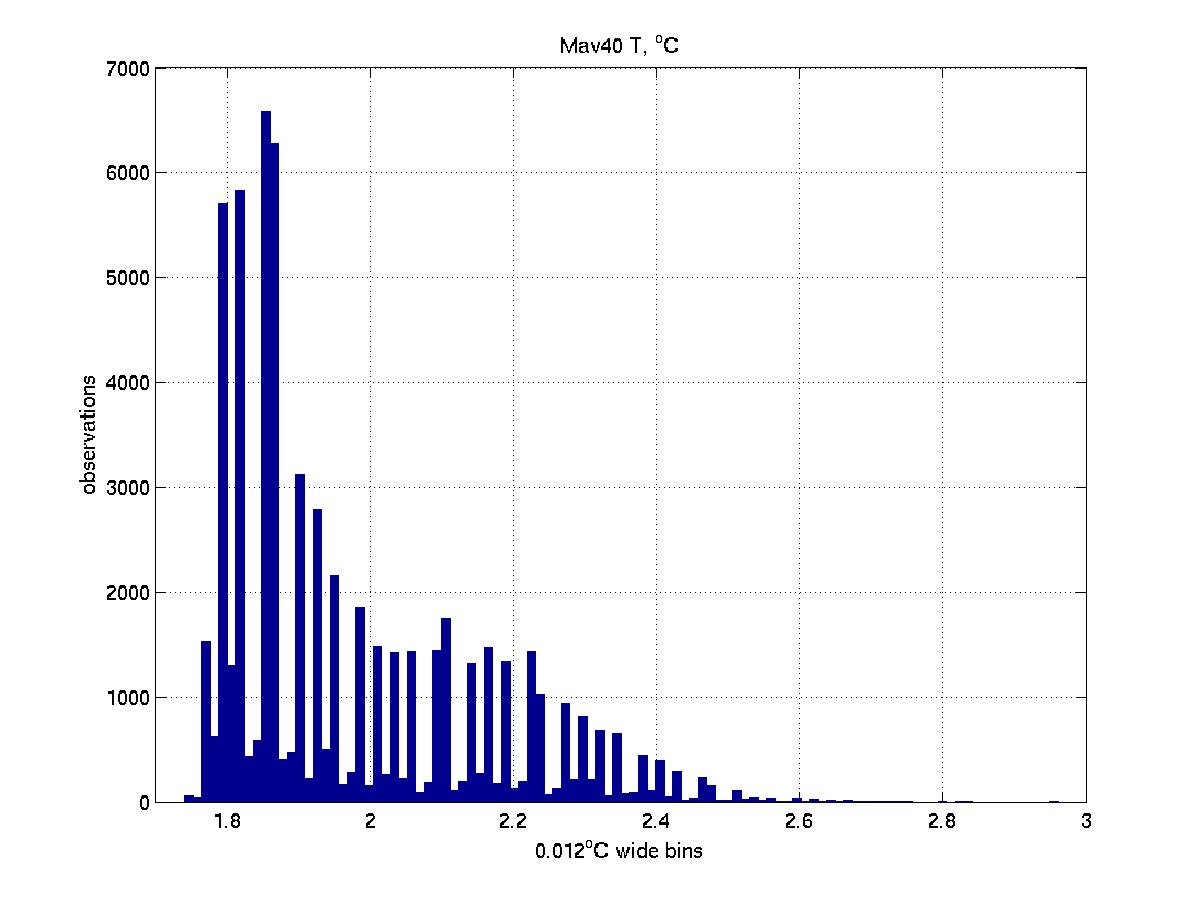
The minimum observed T (1.74oC) and mean T (1.974oC) fall within the
distribution shown below -- a histogram of T (zoomed in to exclude
outliers that are likely spurious, but have not been removed).
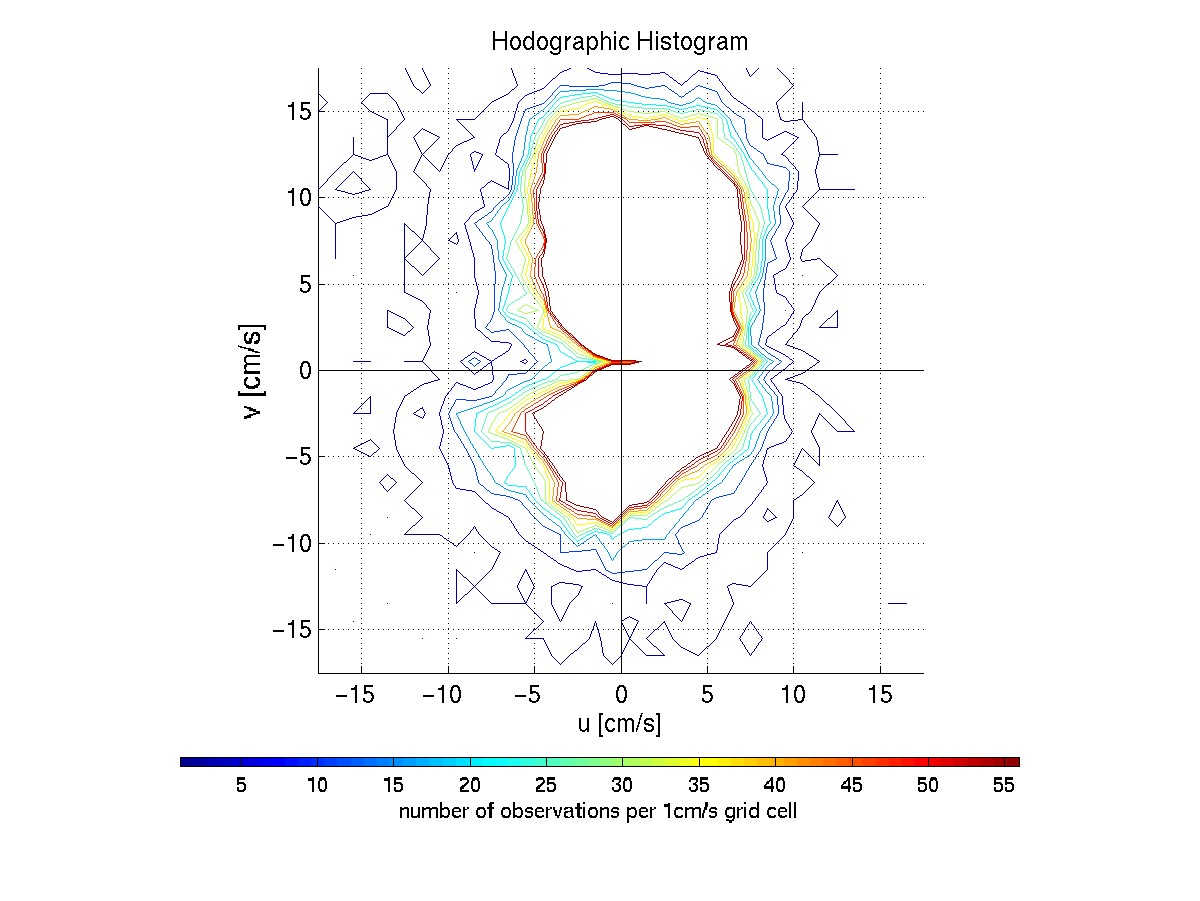
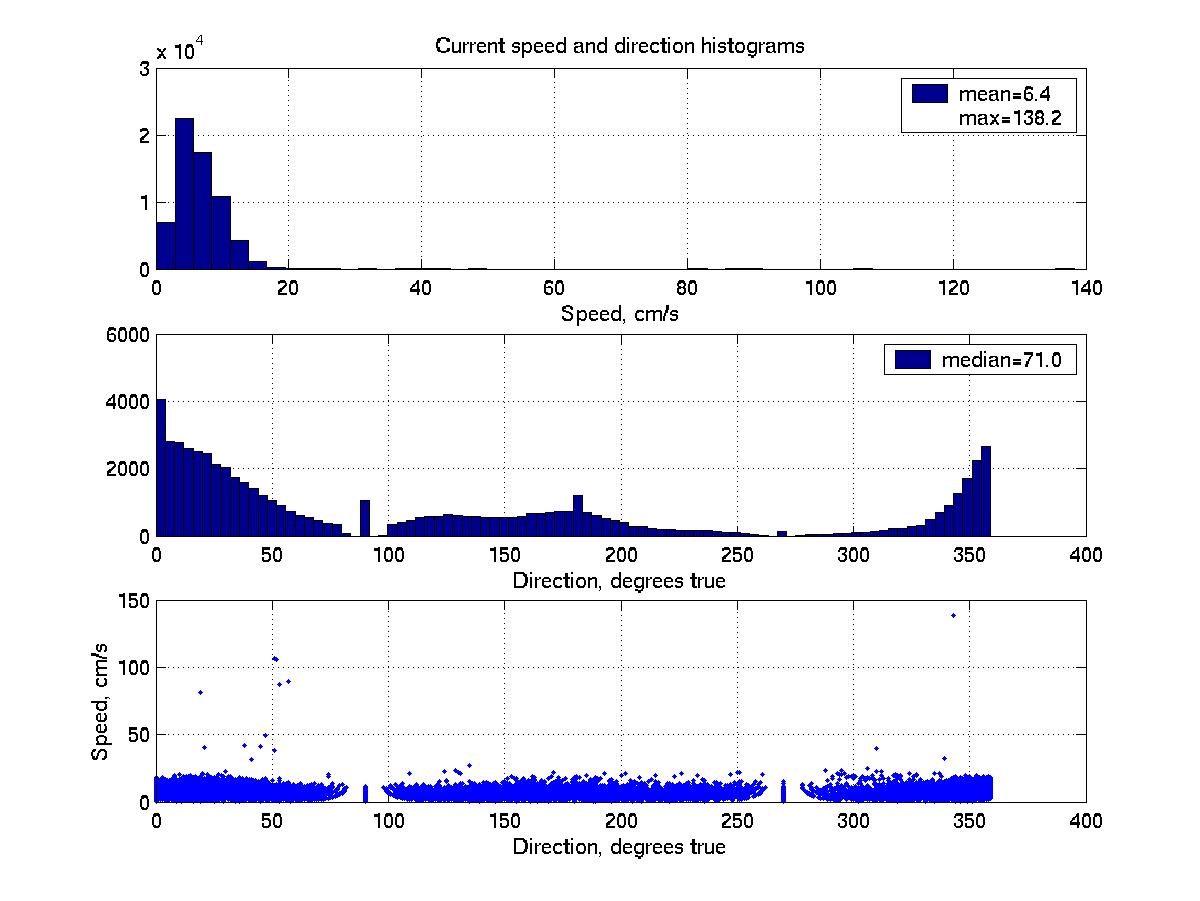
A scatter plot of horizontal speed and direction shows that there are
some directional biases. The data gaps are between
81.7051 and 98.2949 (centered at 90.0000) and
261.7051 279.9539 (centered at 270.0000). The exact centering of the
gaps on 90 and 270 degrees is suspicious... and may suggest a processing
artifact. Or perhaps these gaps are related to the deployment
geometry and/or the axes of the MAVS?
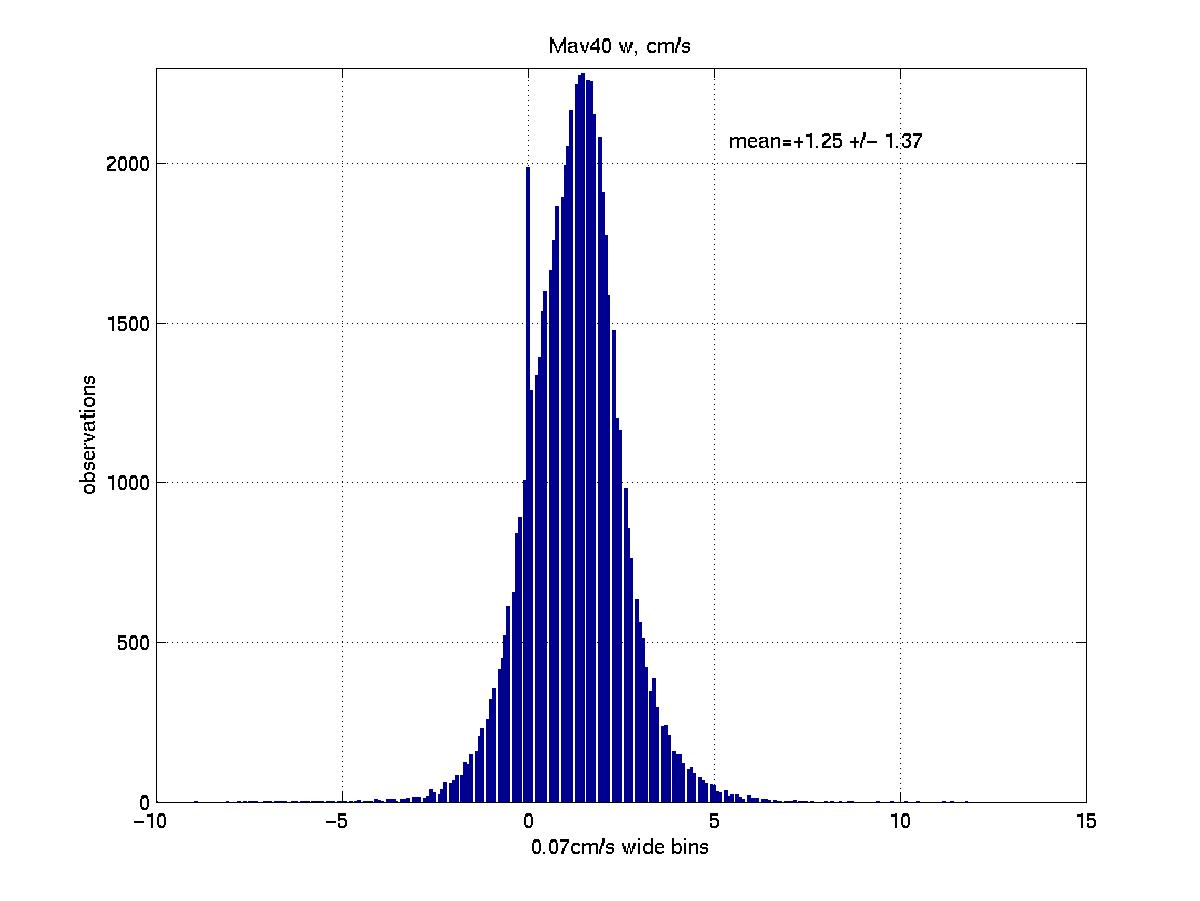
A histogram of vertical velocity (w) shows a slightly skewed distribution
with a mean of +1.25cm/s (upward I assume) and a standard deviation of
1.37cm/s. There are some empty bins, likely related to bin size versus
sampling precision.
quickcurr.m output