Because of its half-life of 5,730 years and its involvement in the carbon cycle, 14C is a uniquely valuable "clock" for studying carbonate deposition and the transition from the last glacial period to the present interglacial.
Source - 14C is produced in the upper atmosphere as a result of incoming cosmic rays (high energy protons). These protons collide with atmospheric components, generating lower energy neutrons in the process. Some of these neutrons, in turn, collide with the nuclei of 14N atoms:
Decay - dN/dt = lambda * N where lambda is decay constant
For N/N0 = 0.5, t(1/2) = ln 2 / lambda
Decay occurs by the nuclear reaction:
Until recently, detection has required the measurement of the electrons released by this decay. Because of the small numbers of disintegrations per hour, this requires extended counting times (days) to get accurate dates, and careful shielding to minimize background counts.
Currently, accelerator mass spectrometry (AMS), which detects the 14C atoms by their mass, rather than their radioactive decay, is the preferred detection method due to its sensitivity and the small amount of sample required (a thousandfold less than for beta counting). However, the most accurate and precise 14C activities still come from beta counting.
Problems - The conversion of 14C activities (or concentrations) into ages is complicated by the following phenomena:
Will be addressed later.
Thus, all 14C data derived from HCO3- or CO3-2 or oceanic organic carbon must be corrected in order to yield meaningful ages..
For surface tropical and temperate waters, contemporary shells and corals have 14C ages of 400 ± 200 years.
Methods to correct/verify 14C ages

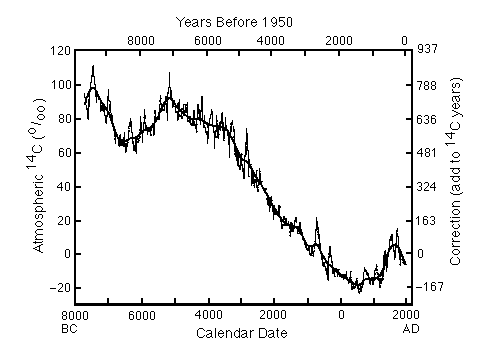
Figure C14-1. Corrections to be added to 14C dates to convert them to calendar dates, based on tree-ring analyses.
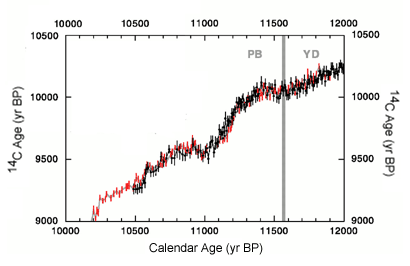
Figure C14-2.Calendar and 14C ages for German pine data (red) and G. bulloides from Cariaco Basin core PL07-58PC (black) which have been aligned by sliding the varve data within a moving 1370 year window to maximize the correlation between the two data sets. YD = Younger Dryas, PB = Preboreal.
In addition, the Cariaco varve sequence extends the record to almost 15,000 years, providing a detailed chronology and 14C record covering the end of the last glacial to the Preboreal (Figure C14-3).
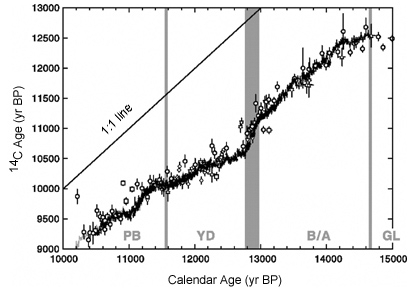
Figure C14-3. Calendar versus 14C ages for Cariaco Basin varves compared to pine, coral, and Japanese lake varve data (see Hughen et al. op. cit.). GL = Glacial, B/A = Bolling/Allerod, YD = Younger Dryas, PB = Preboreal.
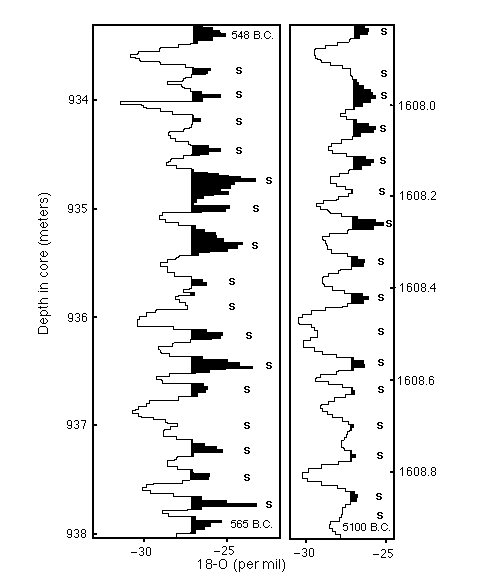
Figure C14-4. Annual layers in an ice core revealed by detailed oxygen isotope profiles. Both the thickness of the annual layers and the amplitude of the oxygen isotope signal decrease with increasing age.
However, the dates of rapid climatic fluctuations during the last deglaciation (Figure C14-5) can be determined and compared with 14C dates of the same events in other records.
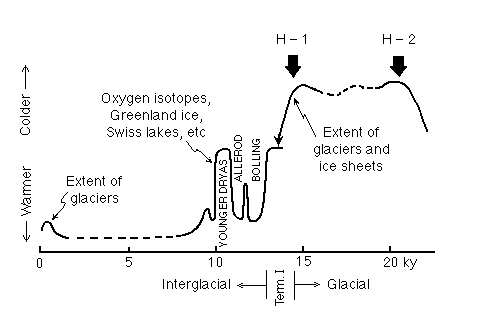
Figure C14-5. Dated events during the transition from the last ice age to the present interglacial. The names are derived from outcrops in Europe and appear frequently in the literature. H-1 and H-2 are the first two Heinrich events (enhanced ice-rafted debris in the North Atlantic) which will be discussed in a subsequent lecture.
238U (t1/2 = 4.47 billion years) - 234U (t1/2 = 244,000 years) - 230Th (t1/2 = 77,000 years) provides a way for dating corals (by measuring the ingrowth of 230Th) as well as checking on the extent to which the coral has been closed to U and Th gain or loss since its formation (by measuring the age-corrected 234U/238U activity ratio to see if it deviates from the seawater value of 1.15).
230Th dates are not as precise as 14C dates, but are more accurate because the systematics of the system are much simpler. The 230Th dates on corals overlap with the tree-ring series, and show the same discrepancies between calendar and 14C years (Figure C14-6).
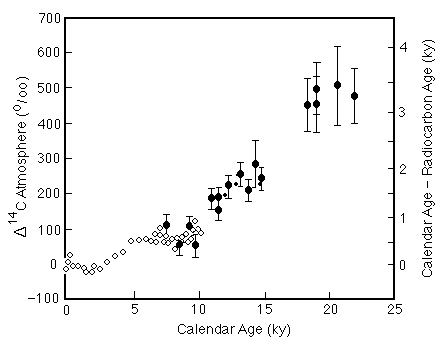
Figure C14-6. Discrepancy between calendar and 14C ages for the past 25,000 years based on tree ring analyses (open circles) and 230Th dating of corals (solid circles with error bars).
The difference between the 230Th and 14C dates of corals are consistent with the 14C corrections inferred from the ice-core dating of the Bolling-Allerod warm interval and Younger Dryas cool interval (the correction increasing from about 1 ky at 11,000 years to 2 ky at 14,000 years). Scandinavian varve data suggest the opposite trend, raising questions as to the continuity of the varve sequence.
The difference between Th/U and uncorrected14C ages create significant differences in the history of the transition from the last glacial to the present interglacial (e.g. Figure C14-7).
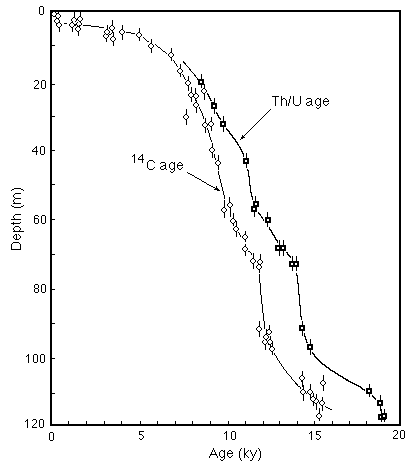
Figure C14-7. Chronology of the rise of sea level from the last glacial to the present based on uncorrected 14C and Th/U dating of corals. The difference in sea level can be as much as 35 m during the interval of rapid rise.
Why do 14C years not correspond to calendar years? Two possible causes have been proposed:
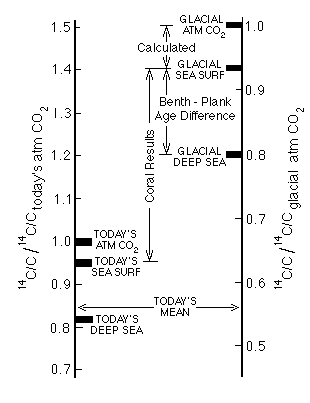
Figure C14-8. Relative 14C/C ratios in the atmosphere and deep and surface ocean waters today and during the last glacial. The data require that the atmospheric 14C/C ratio during the last glacial be about 1.4 times its 1850 value.
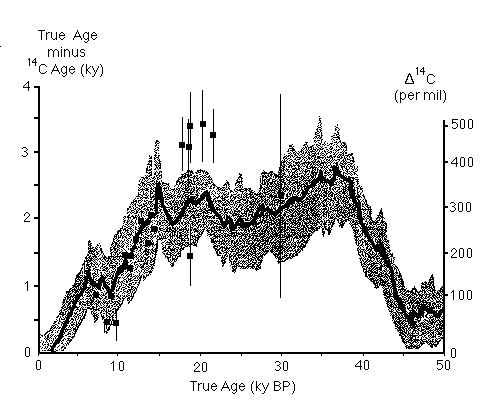
Figure C14-9. Perturbations in 14C ages predicted from the reconstructed record of the intensity of the earth's magnetic field, compared to the results from 230-Th-dated corals (solid squares with error bars).
There are still questions as to the appropriate corrections prior to about 15,000 years, but the younger corrections, which cover the most recent deglaciation, are well established.
Uses - 14C, because it adds a time component not provided by isotopic and trace element tracers, has been used extensively for dating carbonate-bearing sediments and for constraining models of vertical and horizontal mixing in the oceans.
Atmospheric nuclear testing, particularly during the 1960s, added 14C that swamped the natural input. The origin and magnitude of this "spike" is well known, so it can be used to measure the rate and locations of penetration of atmospheric carbon dioxide into the upper ocean, an important parameter in assessing the role of the ocean in taking up greenhouse CO2.
The burning of fossil fuels, which adds "dead" carbon to the atmosphere, has the opposite effect, by reducing its 14C/C ratio. This "Suess" effect began before the turn of the century. Hence, 14C activities are commonly compared to the 1850 atmospheric 14C/C ratio.
|
Oceanography 540 Pages |