Paleoproductivity, because it places important constraints on past ocean circulation, nutrient distributions, and on the history of the oceanic carbon cycle, is a major area of paleoceanographic research. The tracers or proxies that have been used to estimate past productivity include:
Each has its limitations, and different proxies commonly hindcast different productivities.
Carbon-13
As discussed in an earlier lecture, Corg is about 20 per mil
depleted in 13C relative to dissolved CO2, whereas calcite shows
only a slight enrichment (about 1 per mil). Thus, the ![]() 13C values
of planktonic forams in the sediments beneath productive surface
waters will be enriched in residual 13C whereas the contemporaneous
benthic forams will record lowered values because of dilution by 12C
from settling Corg that is oxidized in the deep water. Because the
deep water records the input of oxidative CO2 since it left the
surface, the difference between planktonic and benthonic foram
13C values
of planktonic forams in the sediments beneath productive surface
waters will be enriched in residual 13C whereas the contemporaneous
benthic forams will record lowered values because of dilution by 12C
from settling Corg that is oxidized in the deep water. Because the
deep water records the input of oxidative CO2 since it left the
surface, the difference between planktonic and benthonic foram ![]() 13C values can only be converted to productivity if the "age" of the
bottom water is known.
13C values can only be converted to productivity if the "age" of the
bottom water is known.
The relation between ![]()
![]() 13C (deep water - the preformed
value in surface water) and deep-water phosphate (approximately 0.85
per mil per micromole phosphate) does provide a way of reconstructing
past phosphate concentrations.
13C (deep water - the preformed
value in surface water) and deep-water phosphate (approximately 0.85
per mil per micromole phosphate) does provide a way of reconstructing
past phosphate concentrations.
Concerns:
![]() 13C in benthic forams may not provide accurate deep-water
records because dissolution seems to preferentially remove
13C-enriched tests. McCorkle et al. (1995) found that benthic forams
in cores shallower than 2.5 km from the Ontong-Java Plateau in the
western equatorial Pacific are about 0.2 per mil enriched in 13C
relative to bottom water, whereas the same species in cores deeper
than 4 km are about 0.2 per mil depleted.
13C in benthic forams may not provide accurate deep-water
records because dissolution seems to preferentially remove
13C-enriched tests. McCorkle et al. (1995) found that benthic forams
in cores shallower than 2.5 km from the Ontong-Java Plateau in the
western equatorial Pacific are about 0.2 per mil enriched in 13C
relative to bottom water, whereas the same species in cores deeper
than 4 km are about 0.2 per mil depleted.
Benthic forams show marked interspecific differences and vital effects comparable to the range of values found in the ocean. The stability of these effects over time is uncertain.
Analyses of living benthic forams show lower![]() 13C in
infaunal tests than in epifaunal tests. This is consistent with
regeneration of Corg within the sediments, but complicates the
interpretation of fossil assemblages.
13C in
infaunal tests than in epifaunal tests. This is consistent with
regeneration of Corg within the sediments, but complicates the
interpretation of fossil assemblages.
The paradox of the glacial 13C enrichment of equatorial Pacific
deep water relative to Antarctic water was mentioned earlier. The
gradient between equatorial and northeast Pacific glacial![]() 13C
values (Figure 28-1) does not suggest that the answer lies in the
glacial formation of North Pacific deep water.
13C
values (Figure 28-1) does not suggest that the answer lies in the
glacial formation of North Pacific deep water.
Figure 28-1. Comparison of the ![]() 13C records from equatorial
(V19-30) and northeast Pacific (W8709A-8) cores spanning the last
glacial cycle.
13C records from equatorial
(V19-30) and northeast Pacific (W8709A-8) cores spanning the last
glacial cycle.
Organic carbon
Primary productivity is the rate of generation of organic material, so Corg should be the most direct index of paleoproductivity. Complications include:
2. Additional oxidative loss in the upper part of the sediment column (Figure 28-2).
Figure 28-2. Typical profile of Corg in a North Pacific sediment core, showing the exponential decrease in the near-surface sediments.
Figure 28-3. Relation between Corg in sediments and the sediment flux to the sea floor.
K is about 200, but is location dependent.
Other authors have found that the exponent of Corg in this equation lies between 0.5 and 1. Sarnthein et al. (1988) have related the seafloor flux to new production (Pnew)by the relation:
3. Continued slower Corg loss in deeper sediments, which has the effect of reducing the amplitude of older climatically induced fluctuations (e.g Figure 28-4). Emerson and Hedges have shown that even 100,000 year old organic matter continues to oxidize (Figure 28-5), suggesting that no depth of burial is sufficient to preserve Corg.
Figure 28-4. Decline in magnitude and amplitude with increasing age of Corg peaks in equatorial Pacific sediments, suggesting continued degradation. Numbers above Age scale are oxygen isotope stages.
Figure 28-5. Degradation rate of Corg as a function of its age. Circles are laboratory experiments, squares are field experiments, and crosses are field data and model.
Figure 28-6. Inferred degradation of Corg in anoxic sediments from Santa Barbara Basin.
Again, different authors working in different areas find different values for the constant and exponent in this relation.
5. Terrigenous Corg can make up a significant or even major fraction of the total Corg, particularly along continental margins. This can lead to overestimates of primary productivity and, because terrigenous Corg tends to oxidize more slowly, produces errors in preservation corrections. Terrigenous Corg can be identified by its distinctive composition (n-alkanes for example) but this is rarely done in studies of marine Corg.
Foram Indices
The ratio of benthic to contemporaneous planktonic foraminifera in surface sediments increases with increasing productivity. The quantification of this observation has been frustrated by the overprint of dissolution (which preferentially removes planktonic tests) and the geographic variability of the ratio.
The relative abundance of different planktonic species has been used to estimate productivity via the transfer function approach. Again, dissolution tends to preferentially remove the high productivity index species, and productivity tends to be highly correlated with other environmental variables, such as sea surface temperature. The stability of such correlations over geologic time is unknown.
Benthic foram accumulation rates. Berger and Herguera report that:
Figure 28-7. Correlation between flux to the seafloor of Corg and accumulation rate of benthic forams.
Comparison of glacial and interglacial sediments from the Ontong-Java Plateau (Figure 28-8) shows that glacial benthic foram fluxes were systematically higher, suggesting that primary productivity in this area was 1.5 to 2X its present value during the last glacial.
Figure 28-8. Comparison of benthic foram fluxes as a function of water depth on the Ontong-Java Plateau for recent and last glacial sediments, showing the effect of inferred higher glacial primary productivity.
Opal
Biogenic opal (hydrated silica) does not display the extreme depth dependent dissolution behavior of calcite or aragonite, so is assumed to record production more reliably. Opal is difficult to analyze (it is amorphous to X-rays) and chemical techniques have high blanks due to silica from volcanic ash and clay minerals).
However, a study of the accumulation rates of opal, Corg and CaCO3 in eastern equatorial Pacific sediments (Rea et al., 1991) showed poor correlations between opal and Corg (Figure 28-9). Archer et al. (1993) explained the observed opal accumulation rate and porewater dissolved silica concentrations by suggesting that the ease of dissolution of opal is a function of the production rate, resulting in preservation patterns that are not easily related to primary production.
Figure 28-9. Opal versus Corg for eastern equatorial Pacific sediment spanning the past 1 million years.
Rea et al. (1991; Figure 28-10), also showed that there is a phase lag between the flux of opal and those of Corg and CaCO3, suggesting that the opal flux is responding to something other than primary productivity alone. This result suggests that findings from Antarctica, where carbonate is not preserved and paleoceanographic conclusions are heavily dependent on siliceous microfossils and opal accumulation rates, should be viewed with caution.
Figure 28-10. Phase wheel for the eccentricity (100 ky) band showing equatorial Pacific productivity-related indices.
Primary producers, in the course of their normal metabolic activities, generate an enormous number of distinctive organic compounds. A few of these are relatively resistant to degradation in the water column and sediments, so serve as useful markers of the occurrence and abundance of particular taxa on the overlying water. They have been used as recorders both of paleotemperatures and paleoproductivity.
Figure 28-11 is an example of the use of the accumulation of C-37 alkenones (produced by haplophytes, such as Coccolithus and Gephyracapsa spp.) to infer that productivity in the North Atlantic is forced by precessional changes in the energy budget of this region.
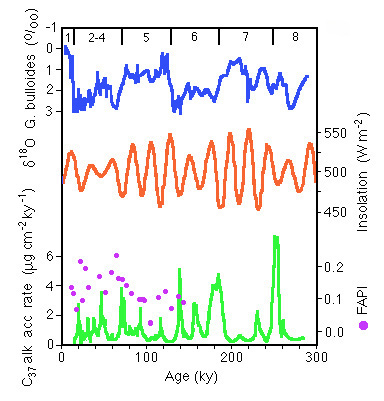
Figure 28-11. C-37 alkanones flux at 43 degrees north in the North Atlantic compared to insolation variations at the same latitude due to precession of the equinoxes and to ice volume as represented by 18-0 in a planktonic foram. FAPI is a fatty acid preservation index that indicates that the the alkanone flux variations are not due to chemical breakdown.
Cadmium/Calcium
The vertical distribution of cadmium in the oceans mimics that of phosphorus. Hence, the Cd/Ca ratio in foram tests has been used as a proxy for past P distributions. This will be considered further in the next lecture.
Strontium
Although strontium is a trace element in seawater, it is used by acantharians (radiolarians) to construct SrSO4 tests. These dissolve below the mixed layer, and are rarely found below a few hundred meters. Thus, like aragonite, strontianite appears to have limited potential in paleoceanography.
Barium
The profile of barium in seawater closely resembles that of silica. Dymond et al. (1992) used sediment trap data to show a strong correlation between Corg and Ba fluxes (Figure 28-12).
Figure 28-12. Correlation between Corg and non-detrital Ba in sediment traps at 1700m and less in the Atlantic and Pacific Oceans.
Corg/Ba decreases with depth from a value of about 200 at 200m to less than 50 at depths in excess of 3000m (Figure 28-13). The accumulation rate data show that Corg decays with depth, whereas Ba is taken up by settling particles. The uptake rate appears to depend on the concentration of dissolved Ba in deep waters (currently about 50 micromol/kg at 1,700 m in the western North Atlantic to 145 micromol/kg in the California current).
Figure 28-13. Decrease of Corg/Ba (non-detrital) in sediment traps as a function of water depth.
The empirical relation between Ba flux, new production, dissolved Ba concentration, and water depth is:
Complications in using Ba fluxes for reconstructing paleoproductivities include:
In less reduced sediments, Mn migration can affect the distribution of sorbed Ba.
Figure 28-14 Correlation between the percentage of non-detrital Ba preserved and the bulk accumulation rate of the enclosing sediment.
Dymond et al. (1992) have taken all these factors into account and developed the following steps to estimate new production from Ba accumulation rates in sediments:
2. Measure Ba and Al concentrations in sediment samples
3. Compute Ba(biol)
4. Compute fraction of Ba preserved
5. Compute flux of Ba(biol)
6. Estimate dissolved Ba from Ba/Ca in benthic forams
7. Compute new production
About 30% of the Ba(biol) flux to the sea floor is preserved, which is higher than the values for CaCO3, Corg, or opal, but still leaves plenty of room for perturbations in the paleoceanographic record!
Paytan et al (1996) have used the relation between the burial flux of Ba and productivity to assess productivity in the equatorial Pacific over the past several hundred thousand years (Figure 28-15). They find that the productivity during glacials was about twice the present value.
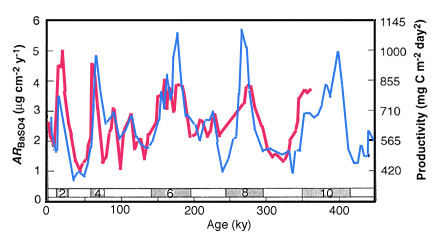
Figure 28-15. Accumulation rate of Ba and inferred productivity of the equatorial Pacific between 110 and 140 W during the past 400 ky. Numbers above Age scale are 18-O stages.
Dissolved Ba. Lea and Spero (1994) used cultured forams to determine that the distribution coefficient Ba/Ca(SW) / Ba/Ca (tests) is 0.147+/-0.004 (Figure 28-16), and is independent of temperature (at 22 and 29 C) and salinity (over a 3 ppt range).
Figure 28-16. Ba/Ca in the tests of a cultured planktonic foram (Orbulina universa) as a function of Ba/Ca in the seawater culture medium.
In Ontong-Java plateau cores, however, McCorkle et al. (1995) found that the distribution coefficient decreases with increasing water depth (Figure 28-17) and appears to correlate with the level of carbonate saturation, suggesting that dissolution may introduce a systematic bias to Ba concentrations based on Ba/Ca values in foram tests.
Figure 28-17. Variations in the distribution coefficient of Ba/Ca in benthic foram tests relative to seawater as a function of water depth on the Ontong-Java plateau (left) and carbonate saturation of the seawater (right).
Aluminum
Al in deep-sea sediments is usually viewed as exclusively non-biogenic and refractory (not affected by dissolution). For this reason, element/Al ratios in average continental rocks are commonly used to correct for the terrigenous contributions of such elements to marine sediments. However, Murray et al. (1993) found that equatorial Pacific sediments are greatly enriched in Al relative to Ti (an even more refractory non-biogenic element), compared to other sediments (Figure 28-18).
Figure 28-18. Al/Ti ratios in equatorial Pacific sediments compared to other sediment types and organisms. The excess is attributed to biogenic scavenging.
They attribute the excess to scavenging of Al from the water column, primarily by CaCO3. They measured the ratio in sediments spanning the past 600 ky (Figure 28-19) and suggest that productivity during the last glacial of about twice the present value was necessary to produce the observed variations.
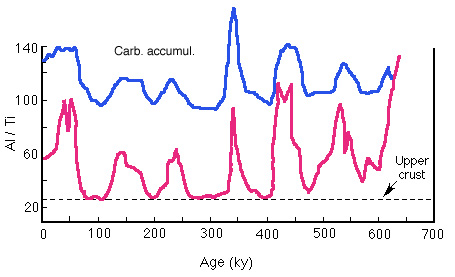
Figure 28-19. Al/Ti ratio in equatorial Pacific sediment spanning the past 600 ky. Variations above the "upper crust" baseline are attributed to variations in productivity.
Panama Basin Sedimentation
A 1991 study by Pederson et al. highlights some of the progress that is being made in unraveling past records of productivity and the challenges that remain.
Background: The level of CO2 was lower in the atmosphere in glacial times as documented by studies of gas inclusions within ice cores (about 190 ppm in glacial times, 280 ppm in interglacial times). A variety of explanations have been offered for this, a common theme being that an increase in productivity plays a role. We can imagine two mechanisms to accomplish this: storage of carbon directly in sediments (productivity determined) or a change of the internal distribution within the ocean so as to increase the deep water concentration (productivity and circulation both play a role).
There is conflicting evidence as to the timing of higher production: some studies suggest that primary production increases are in phase with increased ice volume and lower atmospheric CO2 concentration, while others indicate that the productivity peak lags these two indices.
Pedersen et al. studied cores from the Panama Basin (Figure 28-20):
Figure 28-20. Location of the cores studied by Pederson et al. (1991)
This is an interesting area oceanographically:
Features of the Pedersen et al. data set:
The chronostratigraphy is developed from the oxygen isotopic record:
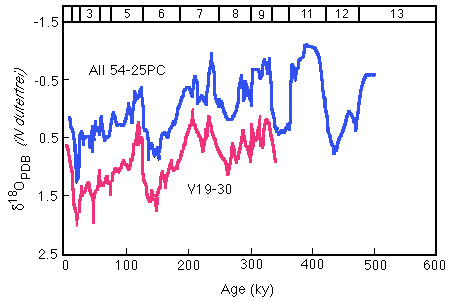
Figure 28-21. Oxygen isotope stratigraphy of Panama Basin cores. Numbers across top of figure are 18-O stages.
We will focus especially on the glacial to interglacial transition 120-130,000 years ago, (termination II, glacial stage 6 to interglacial stage 5)
There is a definite increase in productivity during glacial times as measured by organic carbon concentration and accumulation rate:
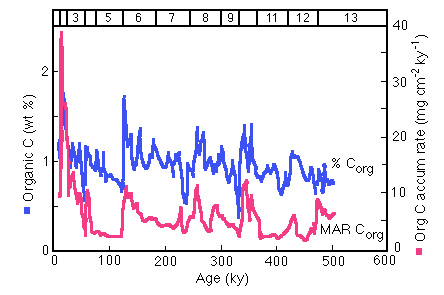
Figure 28-22. Variation in Corg concentration and mass accumulation rate (MAR) over the past 500 ky in core AII54-25PC.
However note that there is no clear relationship to atmospheric carbon dioxide (Figure 28-23); contrast the behavior at 2-1 glacial to interglacial and the 3-2 interglacial to glacial (Figure 28-24):
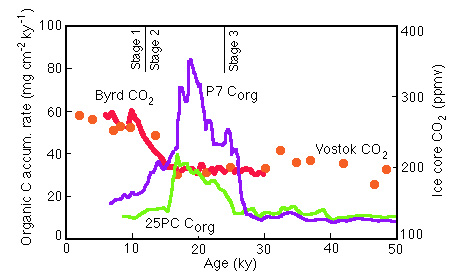
Figure 28-23. Comparison of Corg flux in Panama Basin cores with CO2 records from the Vostok and Byrd Station ice cores.
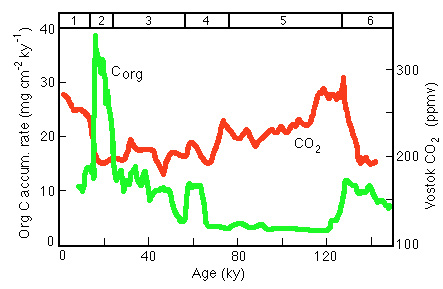
Figure 28-24. Comparison of of Corg flux (a measure of productivity) with the CO2 record in the Vostok ice core.
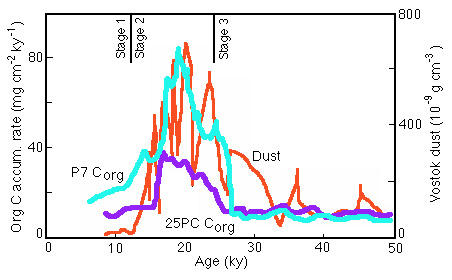
Figure 28-25. Comparison of Corg accumulation rate in Panama basin cores with a dust index in the Vostok Antarctic ice core.
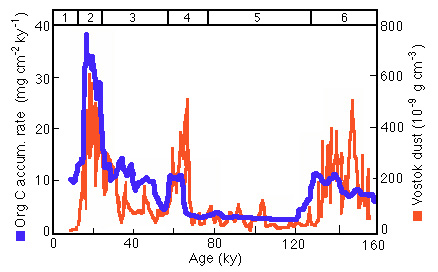
Figure 28-26. Longer term comparison of Panama productivity with dust in Antarctic ice.
The carbon isotopic composition of carbonate gives the change in carbon isotopic composition of the CO2. There is no evidence for significant changes in the partial pressure of carbon dioxide in surface Panama Basin water during glacial times.
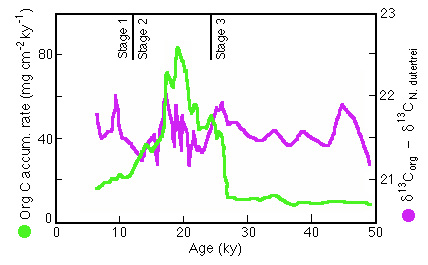
Figure 28-27. ![]()
![]() 13C of organic carbon minus the
contemporaneous
13C of organic carbon minus the
contemporaneous![]() 13C for tests of Neogloboquadrina
dutertrei relative to the mass accumulation rate of Corg in
Panama Basin core P7.
13C for tests of Neogloboquadrina
dutertrei relative to the mass accumulation rate of Corg in
Panama Basin core P7.
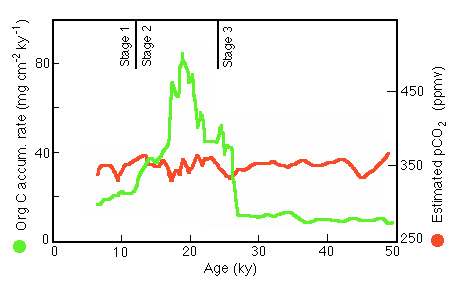
Figure 28-28. Comparison of measures Corg accumulation rate in Panama Basin core P7 with surface water CO2 contentent estimated from the 13C ratio in organic matter (corrected for the global glacial-interglacial 13C change).
Surface waters were always a source, in fact even a stronger source because of the increased gradient and presumably narrower boundary layer induced by greater wind stress.
We conclude from this study that while productivity in the Panama Basin was enhanced during glacial periods (due, perhaps to increased iron input via atmospheric dust), the waters in which this occurred did not become sinks for atmospheric CO2 . The locus of any enhanced penetration of CO2 into the ocean is more likely to have occurred at high latitudes where the solubility of carbon dioxide is high because of generally lower temperatures.
|
| Oceanography 540 Pages Pages Maintained by Russ McDuff (mcduff@ocean.washington.edu) Copyright (©) 1994-2001 Russell E. McDuff and G. Ross Heath; Copyright Notice Content Last Modified 1/2/2001 | Page Last Built 1/2/2001 |