Phase diagrams depict phase relationships within multi-component systems. Phases are physically separate regions of homogeneous chemistry. Possible phases include a liquid phase (multiple liquid phases if the liquids are immiscible), a gas phase, and multiple solid phases. Solid phases may exhibit solid solution, i.e., have a range of compositional variation.
To introduce phase diagrams, we will consider the characteristics of a series of phase diagrams of increasing complexity, beginning with a binary mixture of diopside and anorthite.
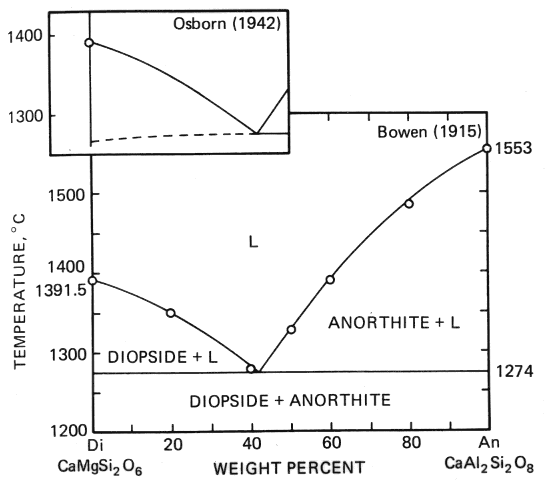
Figure 5-1
Some important elements of this phase diagram include its:
Eq 5-1:![]()
![]()
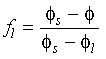
Eq 5-2:![]()
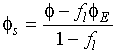
In these and the following equations f![]() is the fraction of liquid and
is the fraction of liquid and ![]() is the composition with the
subscripts E, s and l denoting the eutectic liquid, the solid and the
liquid,
respectively. Melting will continue until the composition of the residual solid reaches the value
1, i.e., the diopside component has melted completely and the residual solid is pure anorthite. At this point the system is no longer restricted to
the eutectic point and the heat applied to system will again increase
temperature. For this example, the critical fraction of liquid is
0.69.
is the composition with the
subscripts E, s and l denoting the eutectic liquid, the solid and the
liquid,
respectively. Melting will continue until the composition of the residual solid reaches the value
1, i.e., the diopside component has melted completely and the residual solid is pure anorthite. At this point the system is no longer restricted to
the eutectic point and the heat applied to system will again increase
temperature. For this example, the critical fraction of liquid is
0.69.
As temperature rises again, once this critical fraction is reached, the liquid composition follows
the liquidus until the liquid is of starting composition An![]()
![]() .
The position of the liquidus indicates the composition of
liquid at a particular temperature. Thus when one of the two solids is present in equilibrium with a liquid, mass conservation requires that for an arbitrary initial bulk composition
.
The position of the liquidus indicates the composition of
liquid at a particular temperature. Thus when one of the two solids is present in equilibrium with a liquid, mass conservation requires that for an arbitrary initial bulk composition ![]() :
:
Eq 5-3:![]()
![]()
Eq 5-4:![]()
In geometric terms:
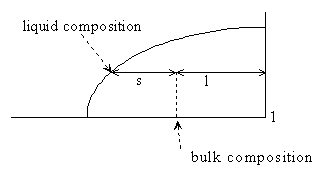
Figure 5-2
and so this mass balance is the basis of the lever rule, i.e.
Eq 5-5:![]()

We call the situtation just described closed system, equilibrium melting. What if melt were continuously separated from residual solids instead? We call this open system melting. Until the critical fraction of liquid is reached, the system behaves in exactly the same way as before--the liquid composition is determined by the eutectic. However once diopside is gone what remains is the single phase anorthite which melts at 1553°C. Obviously the energetics of melting are quite different.
A number of solids exhibit solid solution, for example plagioclase, so that there is compositional variation in a single phase. The phase diagram for plagioclase is:
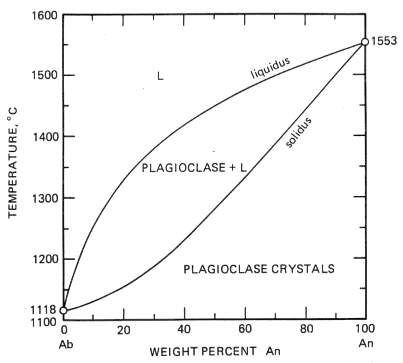
Figure 5-3
The solidus is no longer a horizontal line--the solid composition at equilibrium depends on the bulk composition of the system composition and the temperature. For a given composition, one finds the solid and liquid proportions by applying a lever ruler:
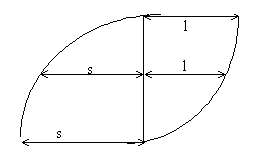
Figure 5-4
As an example consider the cooling of material of composition An![]()
![]() .
The first crystals form at 1450°C, of composition ~An
.
The first crystals form at 1450°C, of composition ~An![]()
![]() . With
continued cooling the liquid composition follows the liquidus and the
solid composition follows the solidus until the original liquid is
fully crystallized at a temperature of about 1333°C. The last
liquid composition is about An
. With
continued cooling the liquid composition follows the liquidus and the
solid composition follows the solidus until the original liquid is
fully crystallized at a temperature of about 1333°C. The last
liquid composition is about An![]()
![]() .
.
It would be unusual at best for a natural solid to follow this closed system, equilibrium behavior. The solid initially formed will either be segregated by mechanical settling or protected from further reaction with the liquid by crystals formed later on the surface (a phenomenon called zoning). We call this path the path of fractional crystallization. In the following figure focus on the curves labelled TSC. These represent the integrated total solid composition obtained as a function of temperature when the solid produced at any instance is in equilibrium with the liquid composition at that temperature--more calcic solids produced early in the crystallization process do not back react with the liquid. The endpoints for the TSC are known, the initial value determined by the gap between the solidus and the liquidus and the final state by the bulk composition of the original liquid. The key differences from equilibrium crystallization are that the last liquid is much more sodium rich and liquid remains in a system to a much lower temperature.
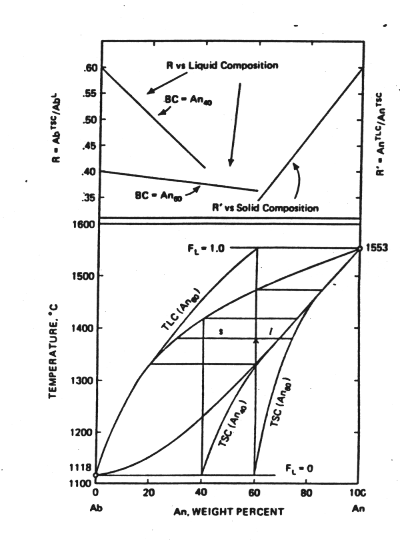
Figure 5-5
Ternary Systems
Multi-component phase relationships can be visualized on a triangular ternary plot. Consider an example involving the three components diopside, anorthite and albite (i.e., there are two phases: diopside and a solid solution of plagioclase).
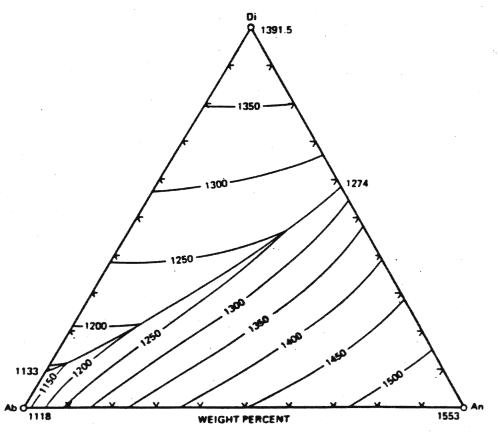
Figure 5-6
There are several features of this diagram to note:
As an example of the application of this diagram, consider the cooling of material of a composition from within the diopside field, say of
composition Di![]()
![]() An
An![]()
![]() Ab
Ab![]()
![]() . As the initial liquid begins to cool, the liquidus is reached at
1300°C and diopside begins to crystallize. The composition of the residual liquid moves
straight down (away from the diopside vertex, because only diopside is
crystallizing). When the cotectic is
reached,
plagioclase also begins to crystallize with the liquid composition locked on
the cotectic. Of what composition is the first plagioclase formed? This
information can't be read from
the diagram; we need additional information. The answer is about An
. As the initial liquid begins to cool, the liquidus is reached at
1300°C and diopside begins to crystallize. The composition of the residual liquid moves
straight down (away from the diopside vertex, because only diopside is
crystallizing). When the cotectic is
reached,
plagioclase also begins to crystallize with the liquid composition locked on
the cotectic. Of what composition is the first plagioclase formed? This
information can't be read from
the diagram; we need additional information. The answer is about An![]()
![]() for this
composition, about 30% higher than liquid, consistent with what we might
have guessed from the phase diagram for plagioclase alone. Upon further cooling, the liquid composition follows the cotectic.
Travel down the cotectic stops when the solid has composition Ab=An, i.e., liquid about
An
for this
composition, about 30% higher than liquid, consistent with what we might
have guessed from the phase diagram for plagioclase alone. Upon further cooling, the liquid composition follows the cotectic.
Travel down the cotectic stops when the solid has composition Ab=An, i.e., liquid about
An![]()
![]() .
.
Contrast the behavior of plagioclase alone and the situation just considered, that of diopside saturated plagioclase
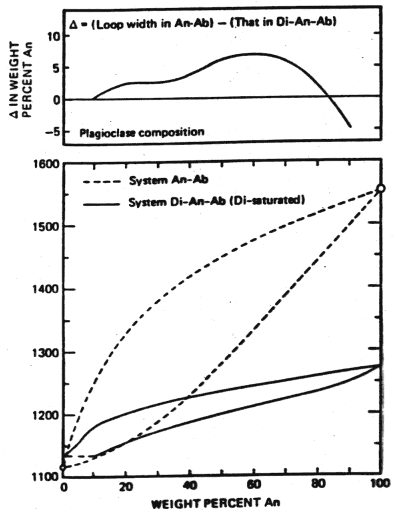
Figure 5-7
At 1200°C, for plagioclase alone the liquid is in
equilibrium with An![]()
![]() crystals contrasted with An
crystals contrasted with An![]()
![]() crystals for the diopside saturated system. There is a much lower temperature of melting across the entire compositional
range and as illustrated in the upper part of the figures, a smaller gap between liquid and solid compositions except at very high An content.
crystals for the diopside saturated system. There is a much lower temperature of melting across the entire compositional
range and as illustrated in the upper part of the figures, a smaller gap between liquid and solid compositions except at very high An content.
Returning to the question of crystallization paths in the system diopside-plagioclase, suppose that instead of starting in the diopside field we start in the plagioclase field. The liquid composition will move directly away from the solid plagioclase composition at that point in the crystallization path; see the diopside-plagioclase phase diagram. Thus, the liquid composition follows a curved path to the cotectic, with the tangent of the curve pointing down to the solid composition at that point in the crystallization sequence.
The subsolidus phase relationships for this system are shown here:
![[Figure 7-1]](f12-4.gif)
Figure 7-1. From (18) (the Hess paper).
The tie-line between the
diopside vertex and the MgSiO![]() point on the Fo-Qtz boundary represents solid
solution of these components. The naturally occurring diopside is of the
composition marked a and the enstatite is of the composition marked
b. Note
the immiscibility gap (indicated by the dashed line) in this solid solution of pyroxenes. The diopside rich member is in the monoclinic crystal system while the enstatite rich member is in the orthorhombic crystal system, thus they are often referred to as clinopyroxene (cpx) and orthopyroxene (opx), respectively.
point on the Fo-Qtz boundary represents solid
solution of these components. The naturally occurring diopside is of the
composition marked a and the enstatite is of the composition marked
b. Note
the immiscibility gap (indicated by the dashed line) in this solid solution of pyroxenes. The diopside rich member is in the monoclinic crystal system while the enstatite rich member is in the orthorhombic crystal system, thus they are often referred to as clinopyroxene (cpx) and orthopyroxene (opx), respectively.
The liquidus at 2 GPa (20 kbar, ~67 km depth) is shown here:
![[Figure 7-2]](f12-5.gif)
Figure 7-2
The bulk composition of mantle peridotite is at the point labelled P--in terms of the minerals Fo, Di(a) and En(b) it has the composition 53:31:16.
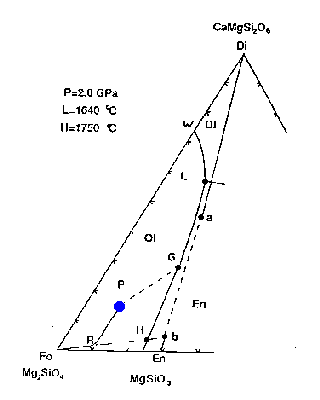
Figure 7-2a
How would melting proceed with addition of heat or adiabatic decompression? The first liquid composition will be at point L, providing that the three phases coexist. This is a peritectic point, i.e., it lies outside the Fo+Di(a)+En(b) triangle. The melting reaction at the peritectic is:
.07 Fo + .93 Di(a) ==> 0.8 liquid + 0.2 En(b)
The melt is generated mainly at the expense of diopside but also minor amounts of forsterite; additional enstatite is produced. The liquid composition stays at point L as long as the three phases are present, while the residual solid composition moves directly away from point L from point P toward point R.
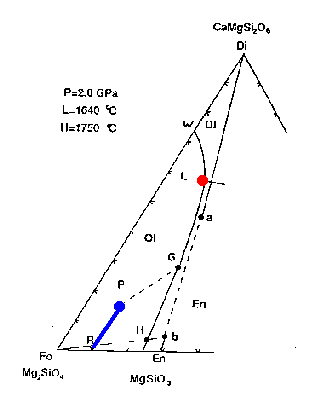
Figure 7-2b
Reaching R marks the point at which all Di(a) has been melted (the solid contains a combination of Fo and En(b).
The liquid composition then follows the Ol-En cotectic toward point G. Anywhere along this part of the liquidus, the intersection of the tangent to this cotectic and the Fo-En(b) tieline gives the proportions in the liquid generated, via the lever rule approximately 6 parts En(b) to 1 part Fo:
0.15 Fo + .85 En(b) ==> liquid
Thus the residual solid composition follows the Fo-En(b) tie from point R toward the Fo vertex. When the liquid composition reaches the point labeled G, the points Fo and P are in line and at this point no En(b) remains in the solid.
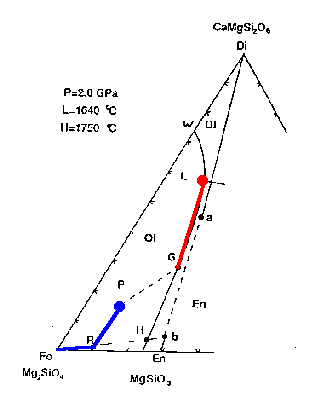
Figure 7-2c
The liquid composition begins to move toward the Fo vertex reaching its final composition P at 100% melting.
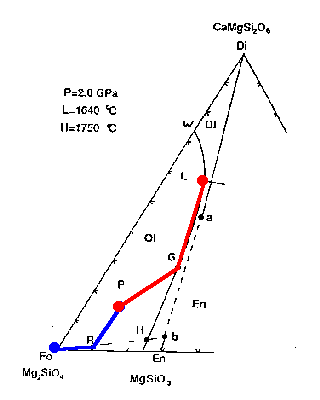
Figure 7-2d
To review we can watch the dance of the melting sequence.
In contrast to the equilibrium melting just discussed, fractional melting (remaining crystals are isolated from the liquid) generates a different relationship between melt produced and the temperature, as shown in Figure 7-3 below. Note the large increase in temperature (heat supply) required to undergo additional melting once diopside is all melted. In this way the amount of diopside in the original melt acts as a strong control on the degree of melting that the mantle undergoes.
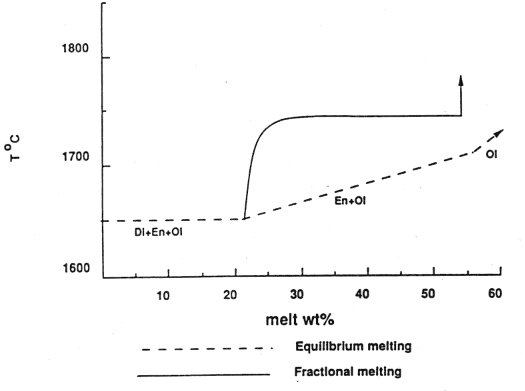
Figure 7-3.
The phase relationships we have been examining are pressure dependent, as this diagram of the liquidus at two different pressures shows:
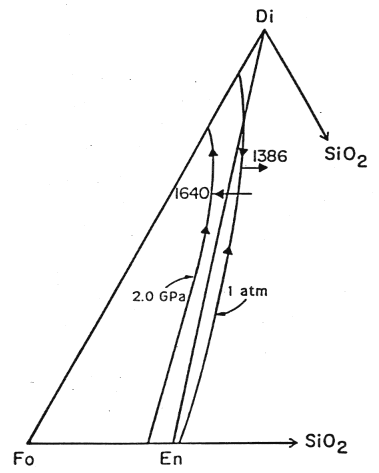
Figure 7-4.
In this diagram, the arrows on the liquidus show the direction of lower temperature. As pressure is reduced, the peritectic moves to a lower temperature (for the 20 kbar drop shown from 1640 to 1386 °C) and to a more Di and Qtz rich composition. If melt produced at the 2 GPa peritectic (point L in the earlier figure) is decompressed it will lie well into the Fo+liquid field. Thus when cooled, olivine will be the first phase to crysallize. The liquid composition will move away from the Fo vertex, intersecting the olivine-diopside cotectic at a point up from the peritectic. Diopside will then crystallize moving the liquid composition toward the 1 bar peritectic. When mantle is melted, the particular composition of the liquid generated will depend on the P-T regime and in particular the point at which the solidus is reached.
Al is not a component within the system Fo-Di-Qtz. Its introduction via melting of garnet is an additional secondary effect as the mantle melts. However its presence plays a much more important role in the crystallization history of the liquid as the basalts making up the crust are formed. At shallow levels in the lithosphere, it is more relevant to consider the system Fo-Di-An (plagioclase (represented by its endmember anorthite in this model is the principal aluminum-bearing phase in basalts):
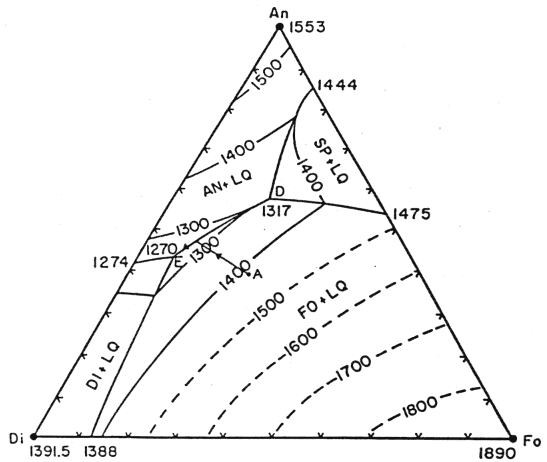
Figure 7-5.
A primitive melt formed in the mantle would have a composition near point A. That liquid would first crystallize olivine, then anorthite (Al bearing), then diopside. Petrographic studies of basalts reveal that crystallization of diopside never follows olivine directly, which restricts the possible composition of the parent melt, i.e., point A cannot be much lower in the diagram. While we will not develop the topic in more depth, it is through approaches of this kind that the melting history of the mantle is constrained. Important tools are the melting relationships affecting major elements and the partitioning of trace elements during melting events.
|
| Oceanography 540 Pages Pages Maintained by Russ McDuff (mcduff@ocean.washington.edu) Copyright (©) 1994-2001 Russell E. McDuff and G. Ross Heath; Copyright Notice Content Last Modified 1/7/2001 | Page Last Built 1/7/2001 |