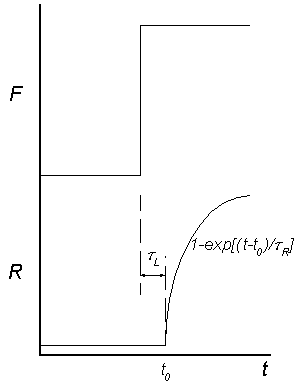
- Confirm that the response depicted follows from the governing
differential equation:
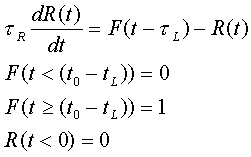
- The Imbrie et al. model itself involves periodic forcing.
For simplicity, assume that there is no delay to the response, but the
system does have a characteristic response time. Thus the governing
differential equation for the responding system is:
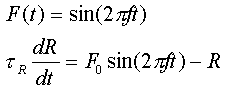
Solve this equation for appropriate boundary conditions. Convince yourself that this system responds in an analogous fashion to the sediment bioturbation model we examined in Lecture 12. - Consider forcing in the (23 ky)-1 frequency band. What is the maximum amplitude of the response if the system responds with characteristic times of 2 and 20 ky.
- What does this result imply for the ability of high frequency forcing to influence different parts of the global climate system (e.g. oceans, ice caps?)
The file
set3-3.mat (to retrieve
this "right click" on the link as "Save Link As" (Netscape) or "Save
Target As" (IE)) contains
values for seven variables t, R1, R2, z1, core1, z2 and core2.
- The records R1 and R2 are records of a hypothetical tracer measured two places at the corresponding times t at two different places in the ocean. Compute the power spectrum of the two records and identify the periodic components present in the them. Extract these frequency band and estimate the phase lag between R1 and R2, expressed as a phase angle at each frequency and as an absolute time interval.
- Two box cores were taken at these same two places and sectioned at two centimeter intervals. The depths and tracer measurements are given in z1 and core1 and z2 and core2 respectively. Compute the power spectrum for each core (using depth as a proxy for time). Estimate the sedimentation rates at the two sites.
- Extract the higher frequency record from the two cores (use filtfilt to preserve the phase information) and compare the phase and amplitude to the tracer records R1 and R2. How do you explain the differences found?
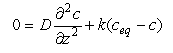
If k is 3x10![]() s
s![]() , D is 5x10
, D is 5x10![]() cm
cm![]() s
s![]() and c
and c![]()
![]() is 300 µM, assess the dependence of the preservation of amorphous silica on the rain rate of amorphous silica (from 1 to 10 g /cm
is 300 µM, assess the dependence of the preservation of amorphous silica on the rain rate of amorphous silica (from 1 to 10 g /cm![]() /ky) and the bottom water concentration of dissolved silica (50 to 200 µM ).
/ky) and the bottom water concentration of dissolved silica (50 to 200 µM ).