The Mixing Zephyr Pages
Mixing Zephyr Program
Notes on Reduction of Data from Mesotech Scanning Sonar
A Mesotech Scanning Sonar is installed on the vehicle in a downlooking
postion. The instrument is capable of stepping in 0.225 degree
increments, although for typical survey parameters faster scans at 0.9
degree increments are appropriate. The data returned consists of two
way travel times for each of the pings transmitted during a sector scan
over an adjustable angle. During the Mixing Zephyr program, the
system was generally running and logging during all operations. In
addition, short dedicated surveys were run in the MEF during Dives 2930
and 2934, the first over the Bastille complex and the second over
Grotto and Lobo.
Data Reduction
A number of processing steps are necessary to translate the instrumental
data into a representation of the topography of the vent field:
- use the geometry of the sonar head to calculate the vertical and
horizontal ranges to the reflecting point. The two way travel time
yields the hypotenuse, h, of a triangle formed by the centerline of the
sonar sweep sector and the point of reflection from the seafloor. The
vertical range is given by h cos(theta) and the horizontal range by
h cos(theta) where theta is the angle of the acoustic beam from
measured from vertical.
- the submersible navigation is use to locate the (x,y,z) triple
describing the position of the sensor head.
- the vehicle attitude (heading, pitch, roll) data is used to map
the range information relative to the sensor head, forming a set of
triples describing the topography.
Dan
Scheirer, when at UC Santa Barbara, developed a number of programs to
complete these steps which can be found in $ZEPHYR/mesoproc. However,
in analyzing some of the initial data manually we recognized some
problems in the data structure; these are discussed elsewhere. Thus, we have not devoted substantial amounts
of time to working up the data we acquired, as Scheirer intends to
repair his code and provide us with a revised version. However we did
some manual processing of the data to inspect data quality and the
adequacy of our survey designs. From these results we were able
to construct along course
profiles, similar to the waterfall display common on swath mapping
sonars. In instances where heading was in a narrow band, we have mapped with them, however making no correction
for vehicle attitude. These corrections, while important, are of the
same order of magnitude as the uncertainty in the navigation and so
while not a final product, the resulting imagery shows major features
reasonably well.
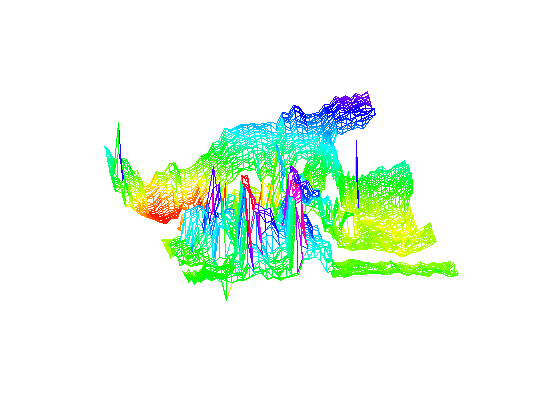
This is an example from the Bastille area viewed from just south of
west. In the far right the west wall of the axial valley rises (grading
to cyan and blue). In
the center foreground are the sulfide structures that make up the
Bastille complex (blues and magenta). Note the steep southern walls and the less steep
northern slopes. The valley floor to the north of Bastille once away
from the wall if quite flat; a significant depression is seen to the
south of the complex.
The viewpoint is toward heading 275, azimuth 45
degrees.

MORP Home | Mixing Zephyr Home | Search the Mixing Zephyr Pages
The Mixing Zephyr Pages
Maintained by Russ McDuff (mcduff@ocean.washington.edu)
Copyright (©) 1995,1996 University of Washington; Copyright Notice
Content Last Modified 10/8/96
Page Last Built 10/8/96

