Oceanography 540--Marine Geological Processes--Winter Quarter 2001
Periodic Phenomena in Vent Environments
One of the more intriguing observations made in vent environments is
that temperatures and flow show periodic fluctuations inferred to be
tidally forced. At present there is no accepted explanation of this
relationship. Indeed, there are question whether the observations
reprsent basic characteristics of vent processes or simply reflect the
influence of tidal currents on the measurement apparatus.
Tidal Forcing
For a comprehensive discussion of tidal generation refer to a standard
physical oceanography text, e.g. (46). The periodic characteristics
of the tide are related to the interaction of astronomical periodic
behavior controlling the spacing and orientation of the Earth, Moon, and
Sun:
| process | period
|
|---|
| Earth spin | 24 h
|
| Moon's orbit | 27.32158 d
|
| Earth's orbit | 365.2422 d
|
| Moon's nodal precesion | 18.613 y
|
| Variation of Moon's perigee | 8.861 y
|
| Variation of Earth's perihelion | 20940 y
|
The forcing can be related to a set of additive tidal constituents (366
of them), the most important of these being:
| | | period
T | amplitude
K (cm)
|
|---|
| M2 | main lunar semidiurnal | 12.421 h | 24.233
|
| K1 | soli-lunar diurnal | 23.93 h | 14.156
|
| S2 | main solar semidurnal | 12 h | 11.284
|
| O1 | main lunar diurnal | 25.82 h | 10.051
|
| P1 | main solar diurnal | 24.07 h | 4.684
|
| Q1 | elliptical lunar diurnal | 26.87 h | 4.684
|
| N2 | elliptical lunar semidiurnal | 12.66 h | 4.640
|
| Mf | lunar fortnightly | 13.66 d | 4.174
|
Tidal analysis involves interpreting long duration records to establish
the phase and amplitude of these constituents at a particular location.
Harmonic analysis is used, i.e., constructing a least squares fit to waveforms of known frequency.
For details see (47) pg 397-402.
Figure 1 shows the tidal forcing due to the first four constitutents all
with phase of zero. The matlab script,
tidebuild.m illustrates the progressive
contributions of the components starting with the dominant M2 tide.
Figure 1. Tidal forcing from M2, K1, S2 and O1 tidal constituents.
Tidal Currents
In order for sea lvel to change fluid must move from place to place
giving rise to tidal currents. In a general sense, tidal currents are
related to the first derivative of the tidal amplitude. In the open
ocean these currents are rotary.
To construct
models for tidal currents, records of current direction and speed are
interpretted as the additive effects of the underlying tidal
constituents.
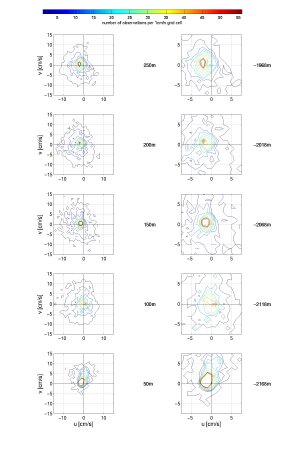
In the vent environment there is a strong influence of topographic
forcing and of frictional boundary effects, especially when there is a
well defined rift valley. As an examle consider the character of current
in the axial valley near Main Endeavour Field, Juan de Fuca Ridge:
Earth Tides
In response to the gravitation fields of the Moon and Sun, the
Earth deforms because it has a certain degree of elasticity. The
amplitudes of motion are much smaller than for the water tide, of order
30 cm and in practice only the first four tidal constituents are
considered when analyzing the earth tide.
Mechanisms
Several mechanism have been suggested that would connect tidal forcing
to vent behavior:
- deformation of the porous netork due to the Earth tide, cuasing a
pumping action.
- effects of pressure on the properties of the fluid, especially for
fluids near to the critical curve for water-sea salt.
- mechanical interactions of vent structures with tidal currents.
Some Representative Observations
As an example of periodic behavior consider these observations from
Schultz et al. (47), taken with an electromagnetic flow appartus
deployed at the "Peanut" structure of Main Endeavour Field. The
appartus consists of a vertical tube sealed by a gasket to the surface
of a vent structure, with measurements made of the flow through and
temperature in this tube.
Figure 3. From (47)
Figure 4. From (47)
The power spectra clearly show an influence of the M2 tide in all of the
records. However an analyis of the coherence between the records
demonstrates that most of the coherence between these records is at
periods >12 h arguing that while tidal signal are evident, most of the
variability is related to long period, low frequency phenomena.
This time series is filtered to pass low frequencies:
Figure 5. From (47)
There appears to be an inverse relatinship between temperature and flow,
perhaps with a small lag. There are some plausible physical
explanations for this inverse relationship but such explanation are at
this point ad hoc in nature.
Tidally related variability is also observed in high temperature, smoker
style vents. These data are from the "Cannaport" vent at
MEF:
This example is representative of many records where a 12 hr periodicity
is present, though not easily interpretable in terms of making a connection
between forcing and response.
A more intriguing (and perhpas unique) record comes from observations
made in 1995 at MEF at the vent structure named "Puffer", a vent poised
on the critical curve (379°C at 220 bars):
The strong excursions in temperature come with a period ~12.4 h, the M2
period, and the strongest excursion is in phase with the full Moon.
However in a long time series taken in the following summer only two
excursions were recorded. In a dive program conducted the following
summer, the pattern was again detected and an ALVIN dive conducted to
measure temperature and collect fluids before, during, and after an
event. A ~20°C excursion was observed. The entrained fluid,
surprisingly, was not seawater, but is consistent with being the
conjugate brine of the relatively fresh venting fluids, conductively
cooled. The mechanism by which these fluids are entrained is likely due
to cracking events of some kind, but it is unclear whether they are
induced by the Earth tide or the pressure flucations due to the water tide.
Next Lecture | Lecture Index | Search the Ocean 540 Pages | Ocean 540 Home
|

| Oceanography 540 Pages
Pages Maintained by Russ McDuff (mcduff@ocean.washington.edu)
Copyright (©) 1994-2001 Russell E. McDuff and G. Ross Heath; Copyright Notice
Content Last Modified 1/24/2001 |
Page Last Built 1/24/2001 |