Long-term climate change (tens to hundreds of thousands of years) appears to be paced and in some cases, forced, by variations in the latitudinal distribution of incoming solar radiation due to changes in the earth's orbital geometry. This relationship is particularly striking for the pattern of alternating glacial-interglacial conditions during the Pleistocene. The marine record has provided a critical test of one of these models, formulated by Milankovitch in the early 1930s.
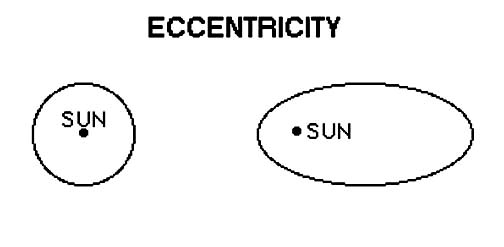
The path of the earth around the sun is slightly elliptical, rather than circular. The eccentricity of the ellipse changes periodically with time, with components having periods of ~100 ky and ~413 ky. The eccentricity is defined as the ratio of the focal length of the ellipse (the distance between the foci) to the length of its major axis; the eccentricity of the earth's orbit about the sun has ranged from less than 0.01 to more than 0.05 over the past 600 ky
Figure 1. Exaggerated range of eccentricity of the earth's orbit.
Figure 2. Variations in the eccentricity of the earth's orbit during the past 600,000 years.
As is suggested by the exaggerated ellipses of Figure 1, variations in eccentricity change the flux of radiation received by the entire planet at different times of the year, but there is no latitudinal effect. In actuality, because the earth's orbit is nearly circular, the radiation effect of eccentricity by itself is very small.
The rotational axis of the earth is not normal to the ecliptic (the plane of the earth's orbit - Figure 3). The present tilt is 23.5º (the latitudes of the Tropics of Cancer and Capricorn). This tilt or obliquity has ranged from 22.1 to 24.5º over the past 700 ky (Figure 4):
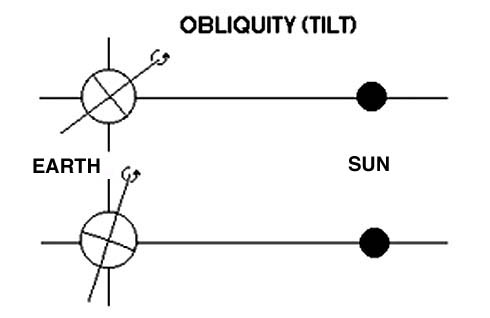
Figure 3. Exaggerated range of tilt of the earth's orbit.
Figure 4. Variations in the obliquity of the earth's orbit during the past 600,000 years.
The exaggerated tilts of Figure 3 illustrate how this parameter affects the seasonality of the earth (the length of day as a function of latitude and season); when the tilt is large, there is more contrast between summer and winter, and the tropics and polar zones both increase in extent at the expense of the mid latitudes. It is easy to see how this parameter interacts with eccentricity--summers will be hot in the hemisphere tilted towards the sun when the earth is at its closest approach to the sun.
Over time, the earth's rotational axis rotates or precesses around the normal to the plane of the elliptic. This precession can be expressed as an angle If the earth's orbit were circular, this would have no climatic consequences. However, because precession changes the locations on the orbit (i.e the times of year) where the hemispheres experience summer and winter, however (Figure 5), the coupling of precession and eccentricity produce variations in the latitudinal distribution of radiation with periods of 23 ky and 19 ky (Figure 17-6).
Figure 5. Exaggerated view of the impact of precession on the energy flux to the earth.
Figure 6. Variations in the precession index of the earth's orbit during the past 600,000 years. (The precession index is the product of the eccentricity and the sine of the angle between closest approach (perihelion) and the vernal equinox.)
Estimates of the effects of tidal friction come from direct laser ranging to the moon, from Babylonian, Hellenic, Chinese, and Islamic historical data on the precession of the equinoxes, and from the number of days in a solar and lunar month recorded in corals spanning the past 450 million years, are reasonably well known and the effects of the remaining uncertainty have been assessed.
Chaotic changes are inherently unpredictable, but their effect back to about 100 to 200 my is small (Figure 7). Prior to about 100 my, the exact motion of the solar system cannot be calculated, so only the ratios of the orbital parameters, not the absolute age of a particular configuration, can be calculated.
Figure 7. Variations in the dominant frequency of precession (left) and tilt (right) of the earth during the past 200 million years (after Berger et al., 1992)
Insolation curves for 65ºN have been prepared for the past five million years. Figure 8 shows the history for the past 600,000 years. In the time domain, this record looks quite different from the oxygen isotopic record of ice volume (Figure 9). In the frequency domain one finds that both records contain power in the three relevant frequency bands, but that the response of the 100 ky periodicity is considerably amplified as compared to the response of the shorter period forcing.
From a stratigraphic point of view, these can be correlated with the geologic record to allow individual events to be dated to within a few thousand years - an accuracy of better than 0.1 percent over 5 million years. The relative ages of two closely spaced events can be determined even more precisely. Residual uncertainties relate both to the orbital parameters, and the offset in time, or lag, between a change in incoming radiation and the response of the geologic and oceanographic proxies that are measured in sediment cores.
|
| Oceanography 540 Pages Pages Maintained by Russ McDuff (mcduff@ocean.washington.edu) Copyright (©) 1994-2002 Russell E. McDuff and G. Ross Heath; Copyright Notice Content Last Modified 11/20/2002 | Page Last Built 11/20/2002 |